Knowing who is doing what, and for how long, is pretty important in education. To help understand this, the DfE publishes School Workforce Data annually, and this provides an important source of information concerning teaching and learning in schools. It can tell us where teaching time is being focused, among other things.
Before we get into the nitty-gritty, there are some important points to note concerning this analysis:
- This dataset is only concerned with England
- It belongs to the DfE and we played no part in collecting it
- Data at subject level is only available for secondary schools
- Our discussion presents our interpretations, and is not a DfE-sanctioned analysis.
Caveats aside, we believe that there is much of interest here to music teachers.
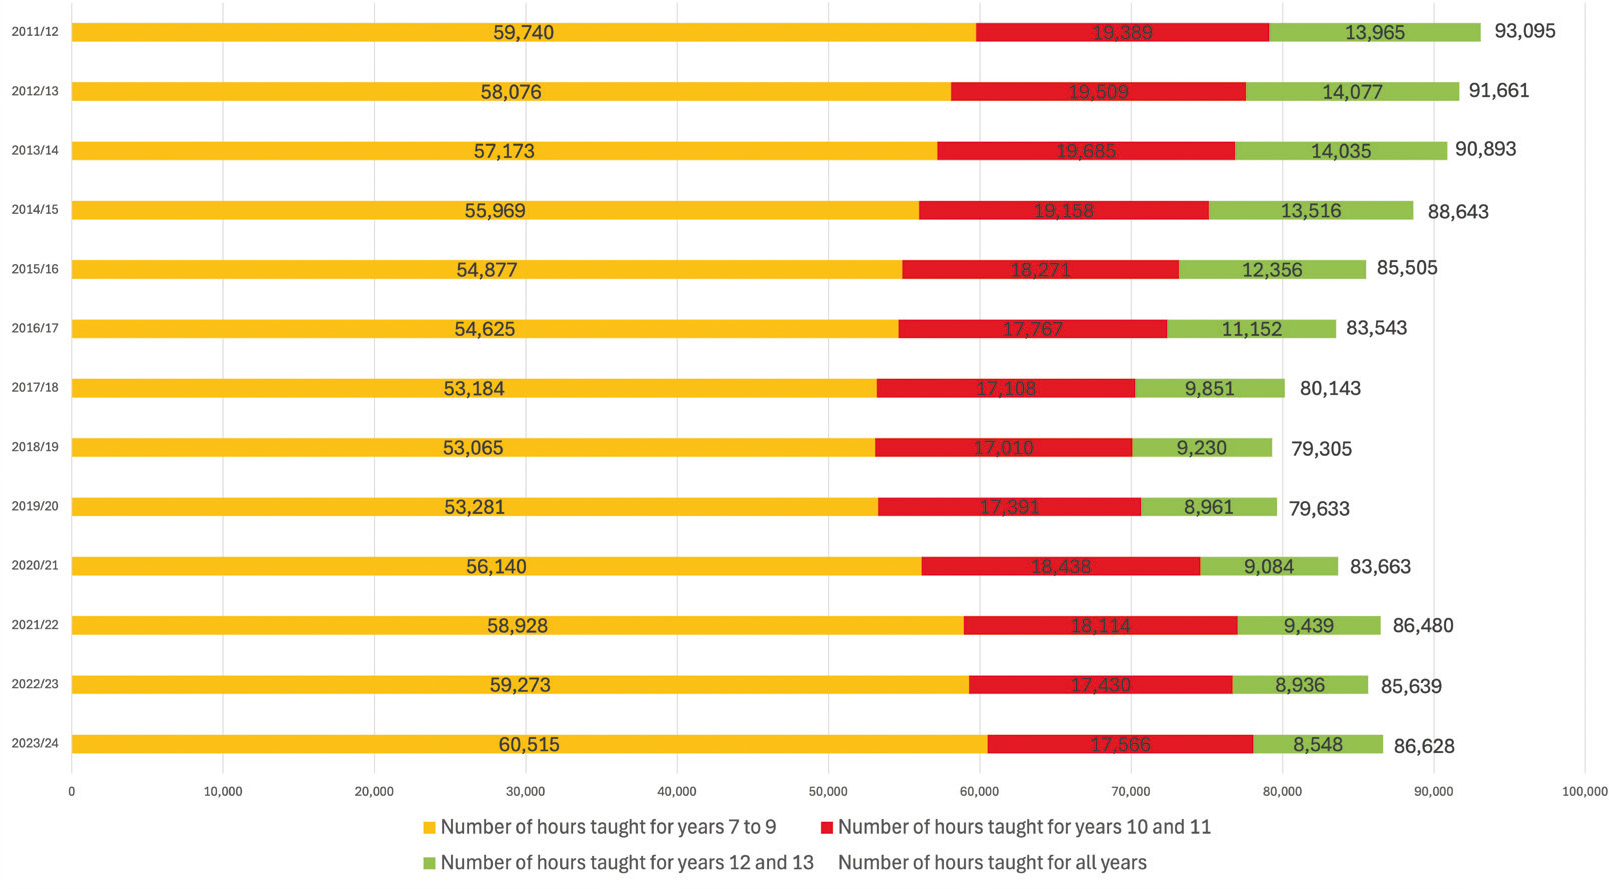
The first point to notice is the amount of time for which music is being taught in secondary schools. Figure 1 shows the changing hours taught at each Key Stage from KS3 to 5 over the last 13 years. What is clear from this is that KS3 shows a varying trend, from 53,065 in 2018/19 up to 60,515 in 2023/24 – an increase of 7,450 hours in this five-year period. The DfE notes an issue with this data: ‘Teachers were counted once against each subject and key stage they taught, irrespective of the time spent teaching. Therefore, teachers may be counted against multiple subjects and key stages so sums of these categories may be greater than the number of secondary school teachers.’ Figure 1. Hours taught at KS3, 4 and 5
This rise in hours, however, needs to be considered alongside the pupil headcount in these years. The DfE recorded 3,193,418 secondary pupils in 2018/19, rising to 3,669,933 in 2023/24, a growth of 476,515 pupils.
What we can also see are the effects of the downtick in pupil numbers choosing music at KS5. There has been a steady reduction in teaching hours at this level, from 14,077 in 2012/13 to 8,548 in 2023/24. In other words, some 39% less time was spent teaching KS5 than in 2012/13. This echoes what we have been saying in the pages of Music Teacher in recent years (including August 2021 and November 2023) regarding worries we have with the reduction in student numbers at this stage.
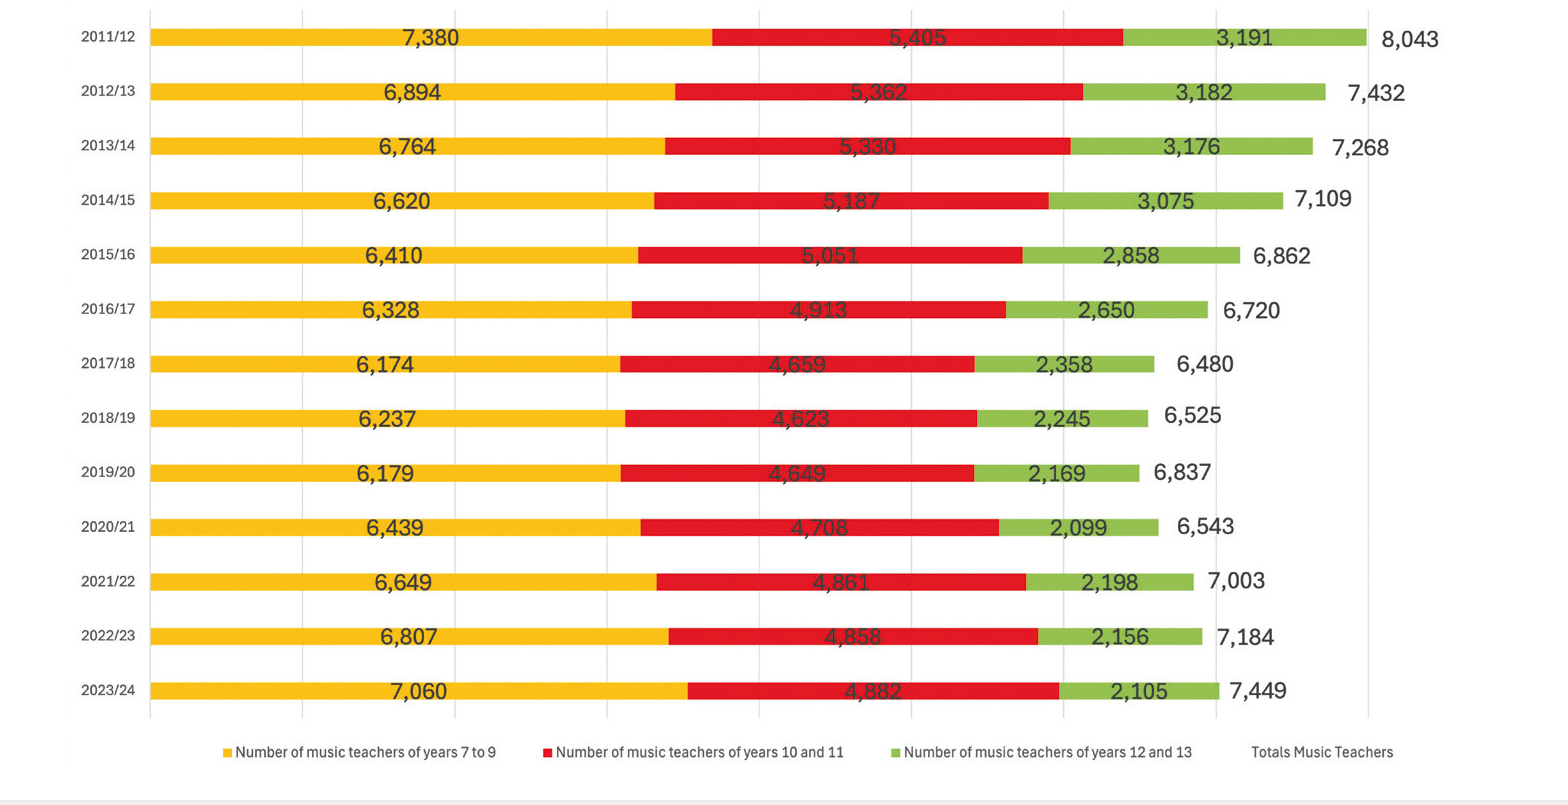
While thinking about the hours taught, there is also a concern for the numbers of music teachers employed in England. Figure 2 shows the changing size of the profession over the years. Here, it is important to note that the totals are not the sum of the various Key Stages. Indeed, the set of KS3 teachers is by-and-large the same group of people who will be teaching at KS4 and KS5 too. Why this chart is useful, though, is because it shows the changing size of the employed workforce, and which Key Stages they are teaching, with the decline from its smallest size in 2017/18 now showing an upturn. This is pleasing to note, although there is still some way to go to return to the staffing levels of 2011/12. Figure 2. Numbers of secondary music teachers in England
However, as we have been hearing about recently, there is a problem with recruitment and retention, and with a diminishing number of applicants to QTS courses. This data is reflected elsewhere in this dataset, where the number of music teacher vacancies on the census-date are shown. These range from the smallest number recorded, which was 9 vacancies back in 2011/12, to the highest, which was 103 in 2023/24.
Finally, it may be a matter of concern to some that the DfE proudly trumpets the fact that approximately 3 in 5 teaching hours were spent teaching EBacc subjects, the EBacc having been widely blamed for the downturn in music take-up at examination level. However, we need more data to see if this is correlation or causation.
Hopefully this brief dip into the workforce data has been of interest, and for us in B-MERG there is plenty for us to continue to think about in our work in music education.


